Node
A class to manage nodes in a tikz environment.
This class is equivalent to the tikz code
Parameters:
| Name | Type | Description | Default |
|---|---|---|---|
position |
tuple)
|
Pair of floats representing the location of the node |
required |
options |
str)
|
String containing node options (e.g., "above") |
''
|
text |
str
|
Text that will be displayed with the node; can use dollar signs $ for LaTeX |
''
|
property
writable
Returns a Point object representing the position of the node. This attribute is modifiable.
Creates a deep copy of a class object. This is useful since in our classes, we chose to set our methods to modify objects, but not return anything.
Examples
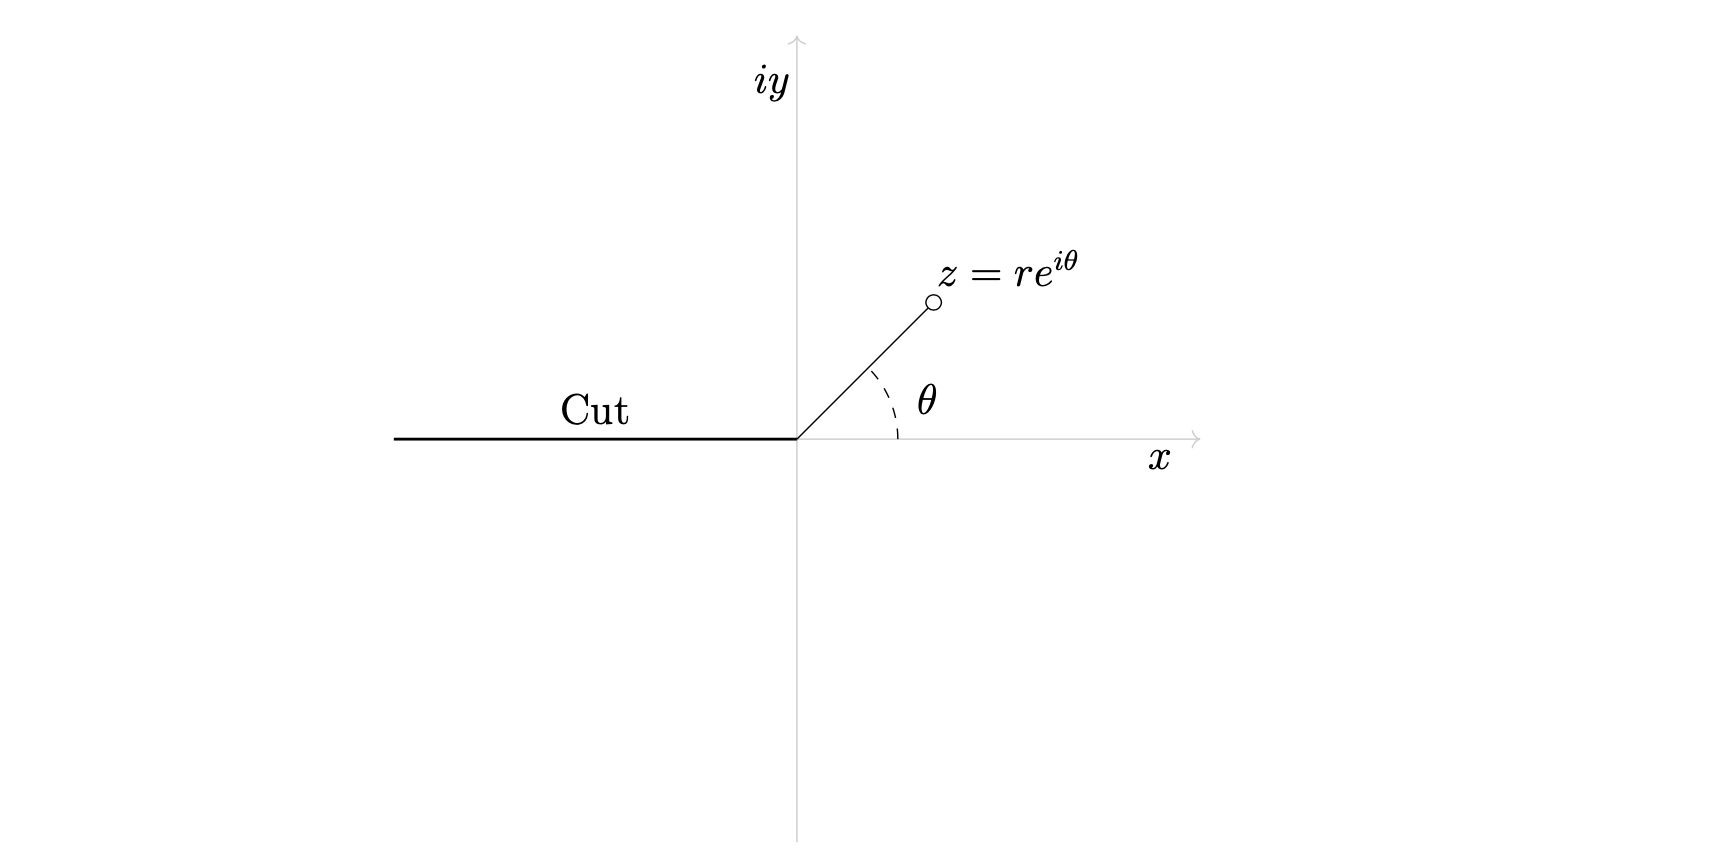
Here we use some nodes to label a figure explaining the logarithm branch cut
import tikzpy

tikz = tikzpy.TikzPicture()
# x,y axes
tikz.line((-4, 0), (4, 0), options="Gray!40, ->")
tikz.line((0, -4), (0, 4), options="Gray!40, ->")
# Cut
tikz.line((-4, 0), (0, 0), options="thick")
# Line out
tikz.line((0, 0), (1.414, 1.414), options="-o")
tikz.arc((1, 0), 0, 45, radius=1, options="dashed")

# Labels
tikz.node((3.6, -0.2), text="$x$")
tikz.node((-0.24, 3.53), text="$iy$")
tikz.node((1.3, 0.4), text="$\\theta$")
tikz.node((2.1, 1.7), text="$z = re^{i\\theta}$")
tikz.node((-2, 0.3), text="Cut")
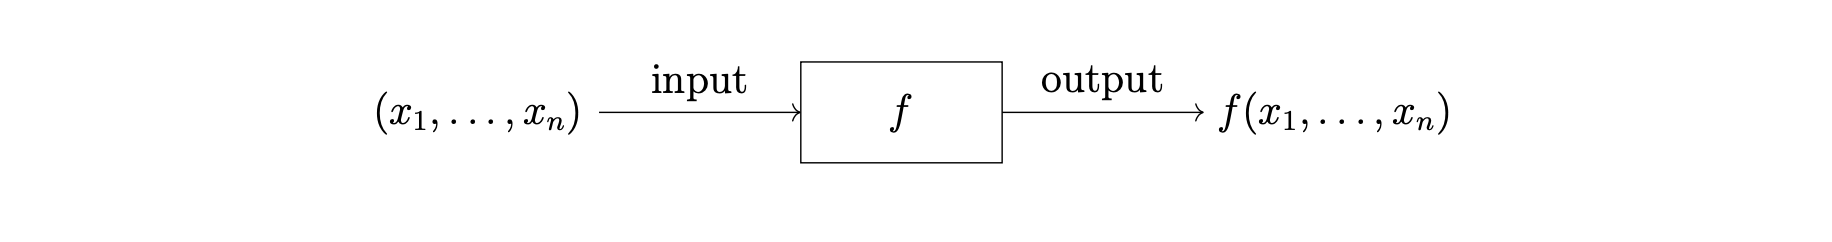
Here's another example of usings nodes to illustrate the concept of a multivariable function.
import tikzpy

tikz = tikzpy.TikzPicture()

arrow_len = 2
box_width = 2
# Lines and rectangles
input_arrow = tikz.line((0, 0), (arrow_len, 0), options="->")
box = tikz.rectangle_from_west(input_arrow.end, width=box_width, height=1)
output_arrow = tikz.line(box.east, box.east + (arrow_len, 0), options="->")

# Labels
tikz.node((-1.2, 0), text="$(x_1, \dots, x_n)$")
tikz.node(input_arrow.midpoint() + (0, 0.3), text="input")
tikz.node(box.center, text="$f$")
tikz.node(output_arrow.midpoint() + (0, 0.3), text="output")
tikz.node((7.3, 0), text="$f(x_1, \dots, x_n)$")
tikz.show()